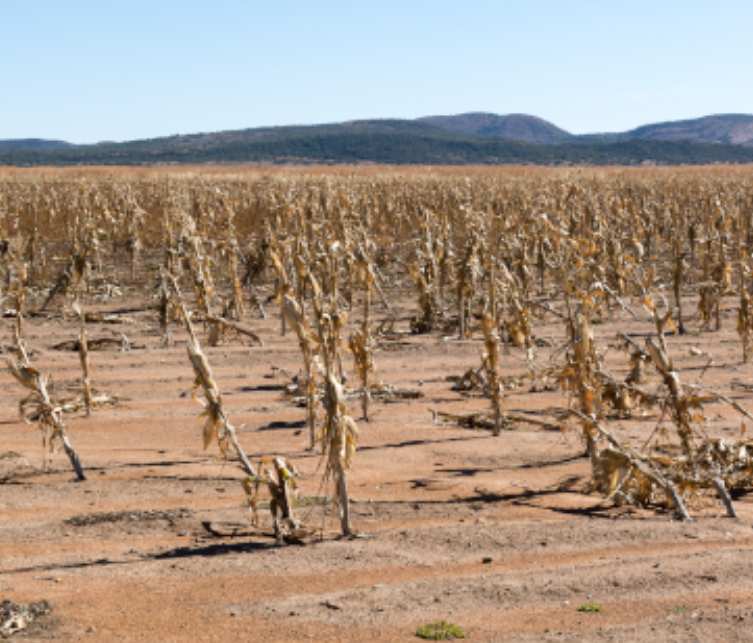
ARCADIA SIT is a partner of the European consortium for the provision of services in the field of GIS and remote sensing, under the European framework contract DIGIT II. Within the Framework Contract ARCADIA SIT participated in the development of the EDO project, carried out by the JRC – IES – Institute for the Environment and Sustainability / Land Management and Natural Hazards / Desertification Unit. Drought is not only a temporary lack of rain but also occurs when soil moisture decreases considerably, in this scenario, crops and natural vegetation suffer due to low water availability, therefore, great efforts have been made to estimate soil moisture using soil water balance model and other atmospheric data (ground observation, numerical weather forecast, etc.). The European Drought Observatory was set up by the European Commission to monitor and evaluate the phenomenon of desertification in Europe and provide forecasts on its impact. The data used come from different fields (meteorology, hydrology, soil moisture, crops and vegetation) and are analysed in such a way as to provide real-time reports and drought forecasts, both within specific and restricted areas and wider. With the resulting information, models are developed and thematic maps drawn up and then made public through a Webgis implemented ad hoc. The functionality of the webgis is to allow the user to view the various maps produced together with other geographical data and to query the different layers. The purpose of the EDO is not only to present the results of the models used within the JRC for drought monitoring, but also to act as a coordinating body for European research canters and bodies dealing with droughts , managing a network of relationships and organizing the sharing and presentation of data and maps produced by the various parties. Maintenance and set up of web tools to generate drought indicator maps and graphs and to manage web pages and their translations in different languages. Passage of input data, GIS, data mining and ad-hoc routines to analyse the data and output maps of the phenomenon in a time series. The EDO pages contain drought-relevant information, such as indicator maps derived from different data sources (e.g. precipitation measurements, satellite measurements, soil moisture content). Various tools allow for the visualization and analysis of information, and the publication of "Drought News" provides an overview of the situation in the event of impending droughts. One of the main components of the system is the browser (webgis). The browser is the window through which users interact with each other and with web applications. To verify that the system works correctly, we need a way to simulate the interaction between the browser and the web application. Indeed, different browsers have different behaviours and full transparency must be ensured to make the product browser independent. For testing the individual functions, we have defined programs capable of performing self-tests to verify the functionality of the system.
The drought assessment is carried out using individual indices, based on meteorological data or remote sensing images. Developing a combined index that integrates meteorological and remote sensing indicators can help reduce false alarms, for example where vegetation indices indicate a reduction in biomass that may be generated by reasons other than water stress. The proposed combined indicator is based on the three main EDO indices: SPI, soil moisture and FAPAR.
EDO analyses the datasets to produce analysis and statistics such as:
CLIENT: JRC